This page provides step-by-step instructions for finding information on sector-level emissions trends.
When you first enter the Facility Level Information on Greenhouse Gases Tool (FLIGHT), you will be presented with two search options:
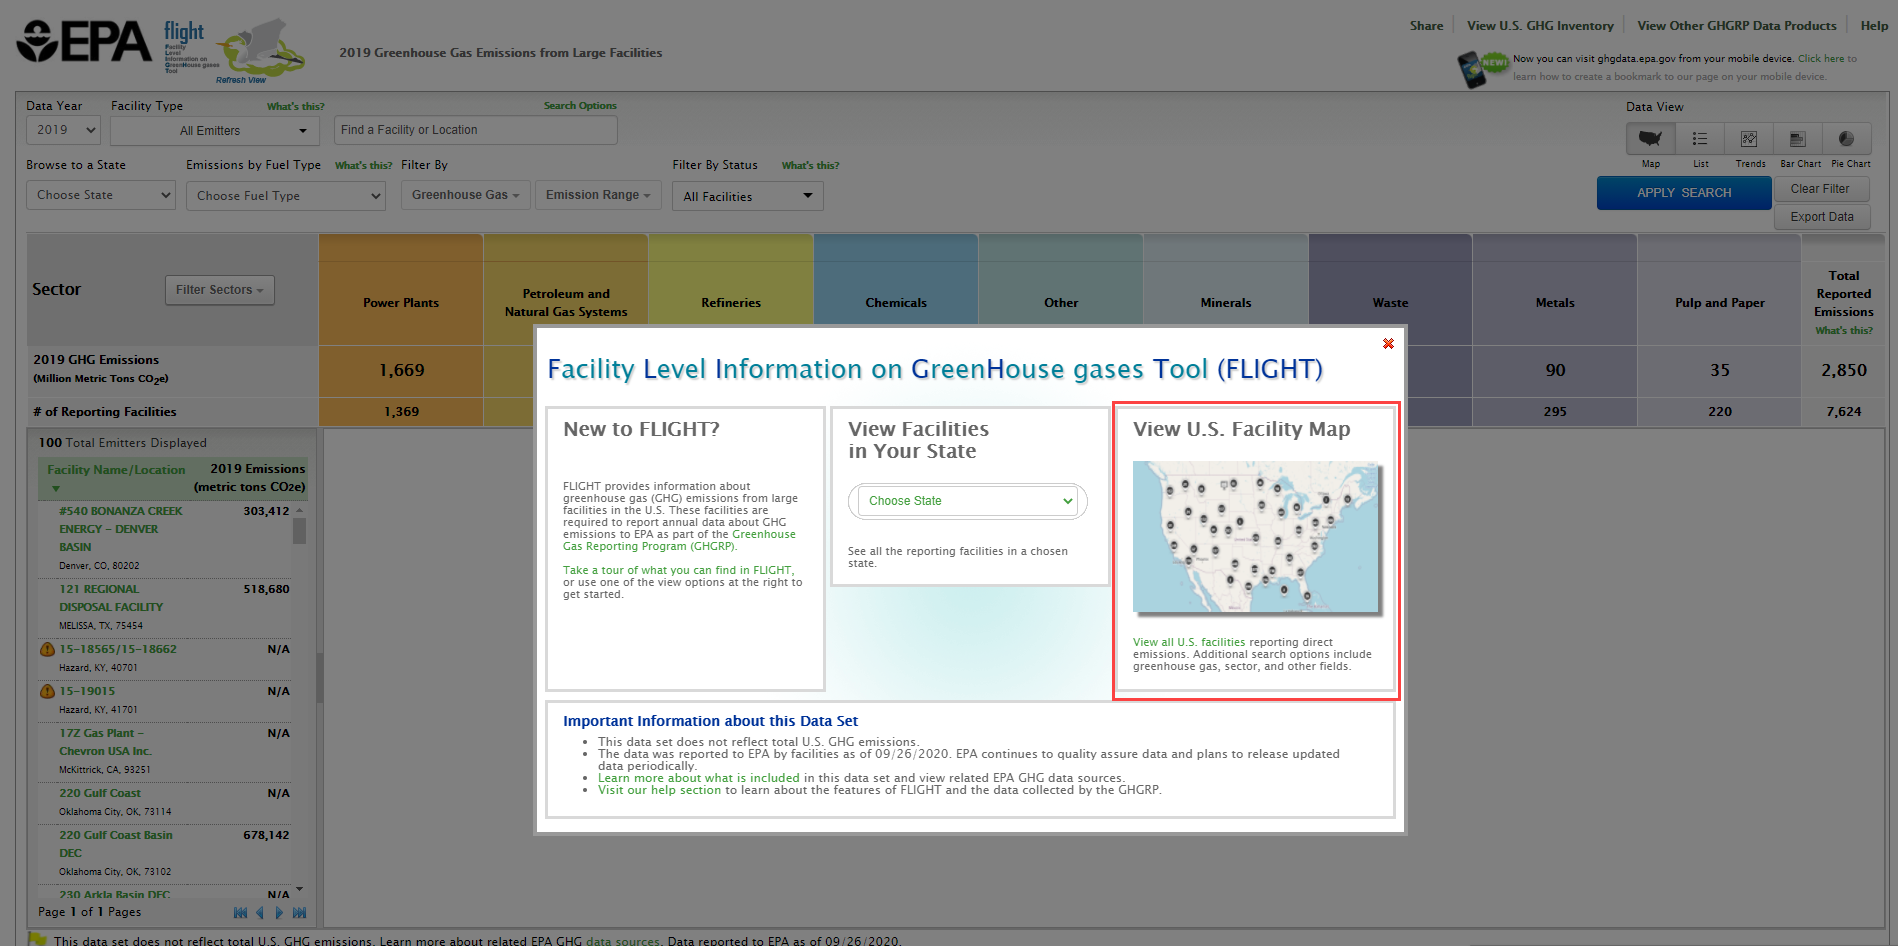
Click image to expand below Click the box at the left of the popup window to View all U.S. Facility Data.
Click image to expand belowStep 1. Go to FLIGHT

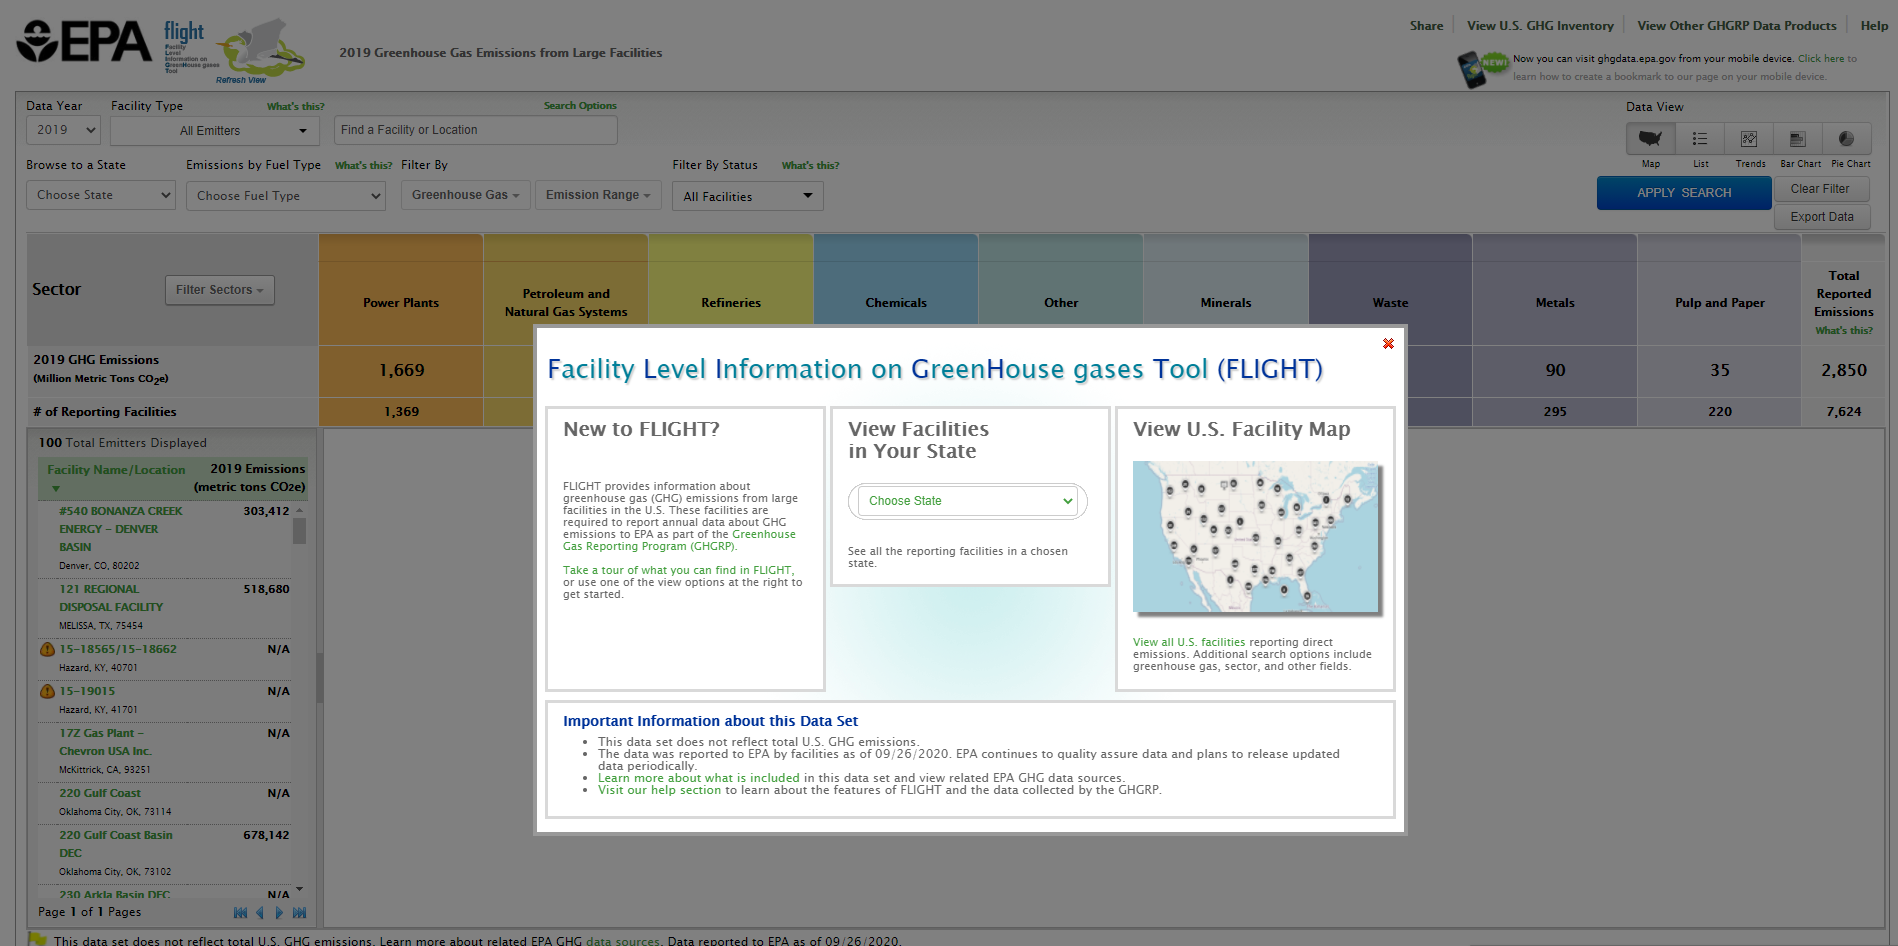
Step 2. Select national search option

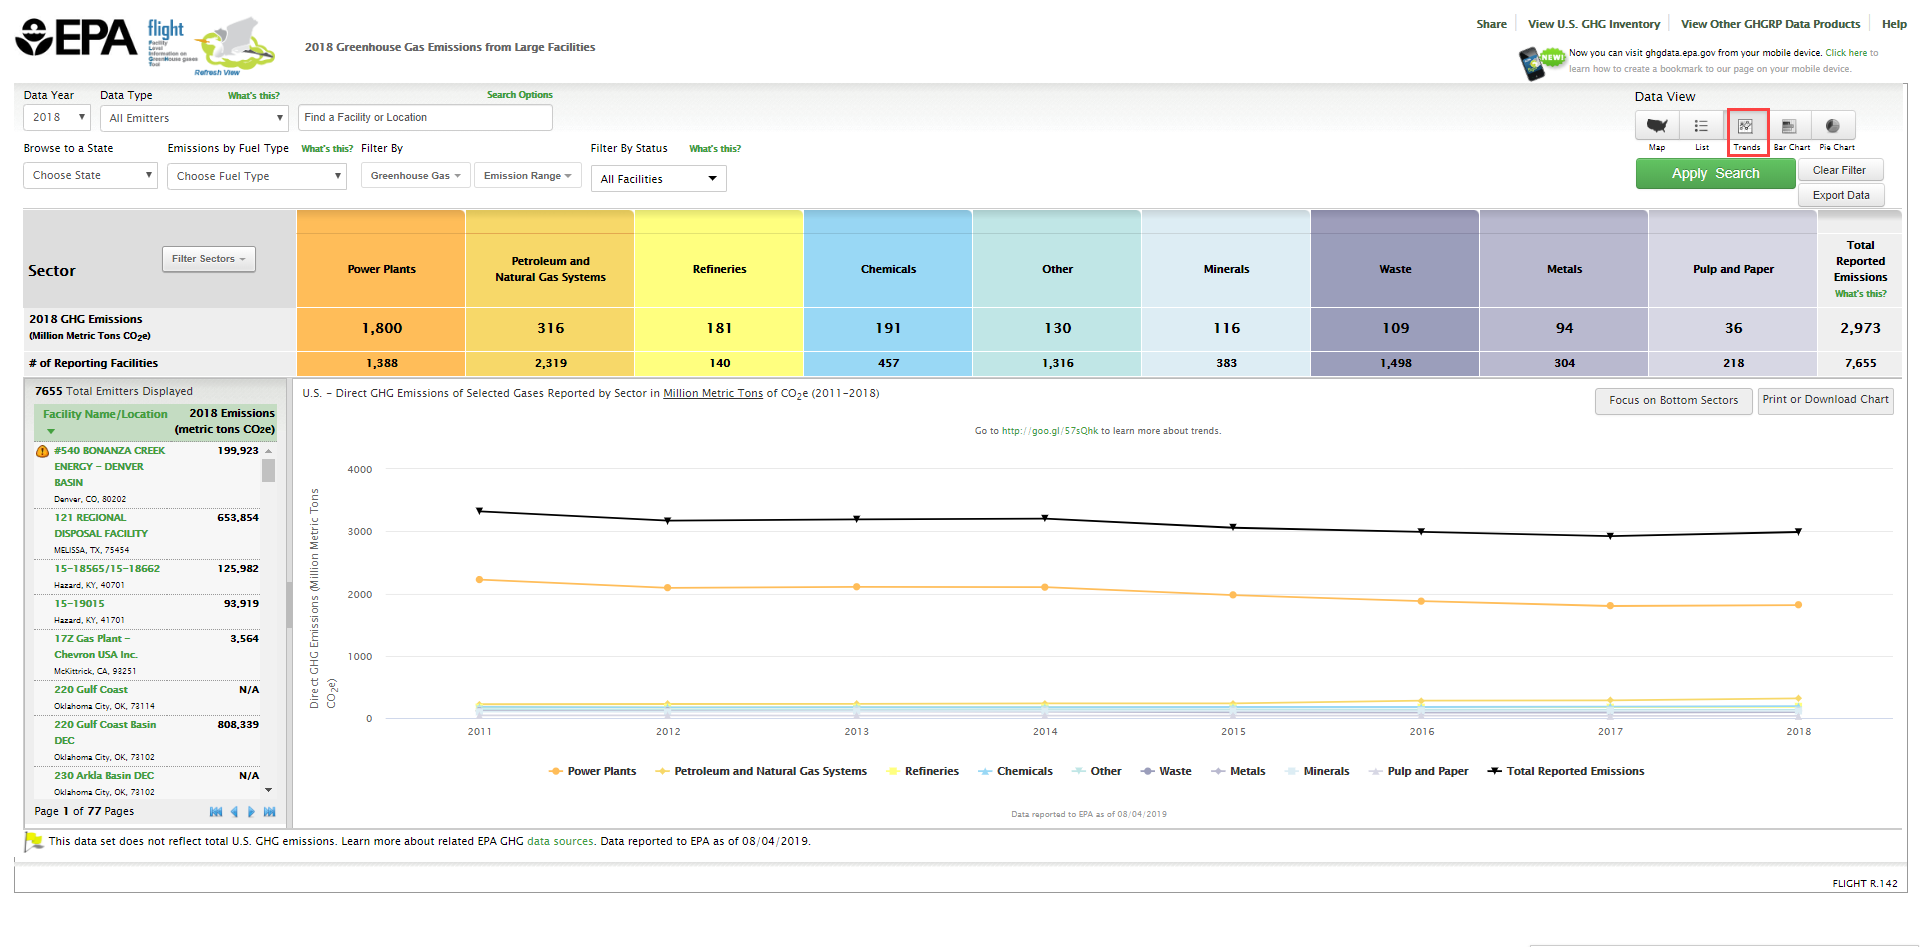
Step 3. Switch from Map View to Trend view
Click on the “Line Chart” button to view facility trends in emissions over time by sector.
Click image to expand below
Step 4. Select Desired Parameters
Select the industry types you would like to plot using the dashboard at the bottom of the screen, the geographic region you would like to plot using the state/country drop down menu, and the GHGs you would like to plot using the GHG drop down menu.
Click image to expand below

Step 5. Download Chart
Once you have selected your parameters, you can also download your view as a PNG, JPEG, PDF, or SVG vector image by selecting the “Print or Download Chart” in the upper right section of the screen.
Click image to expand below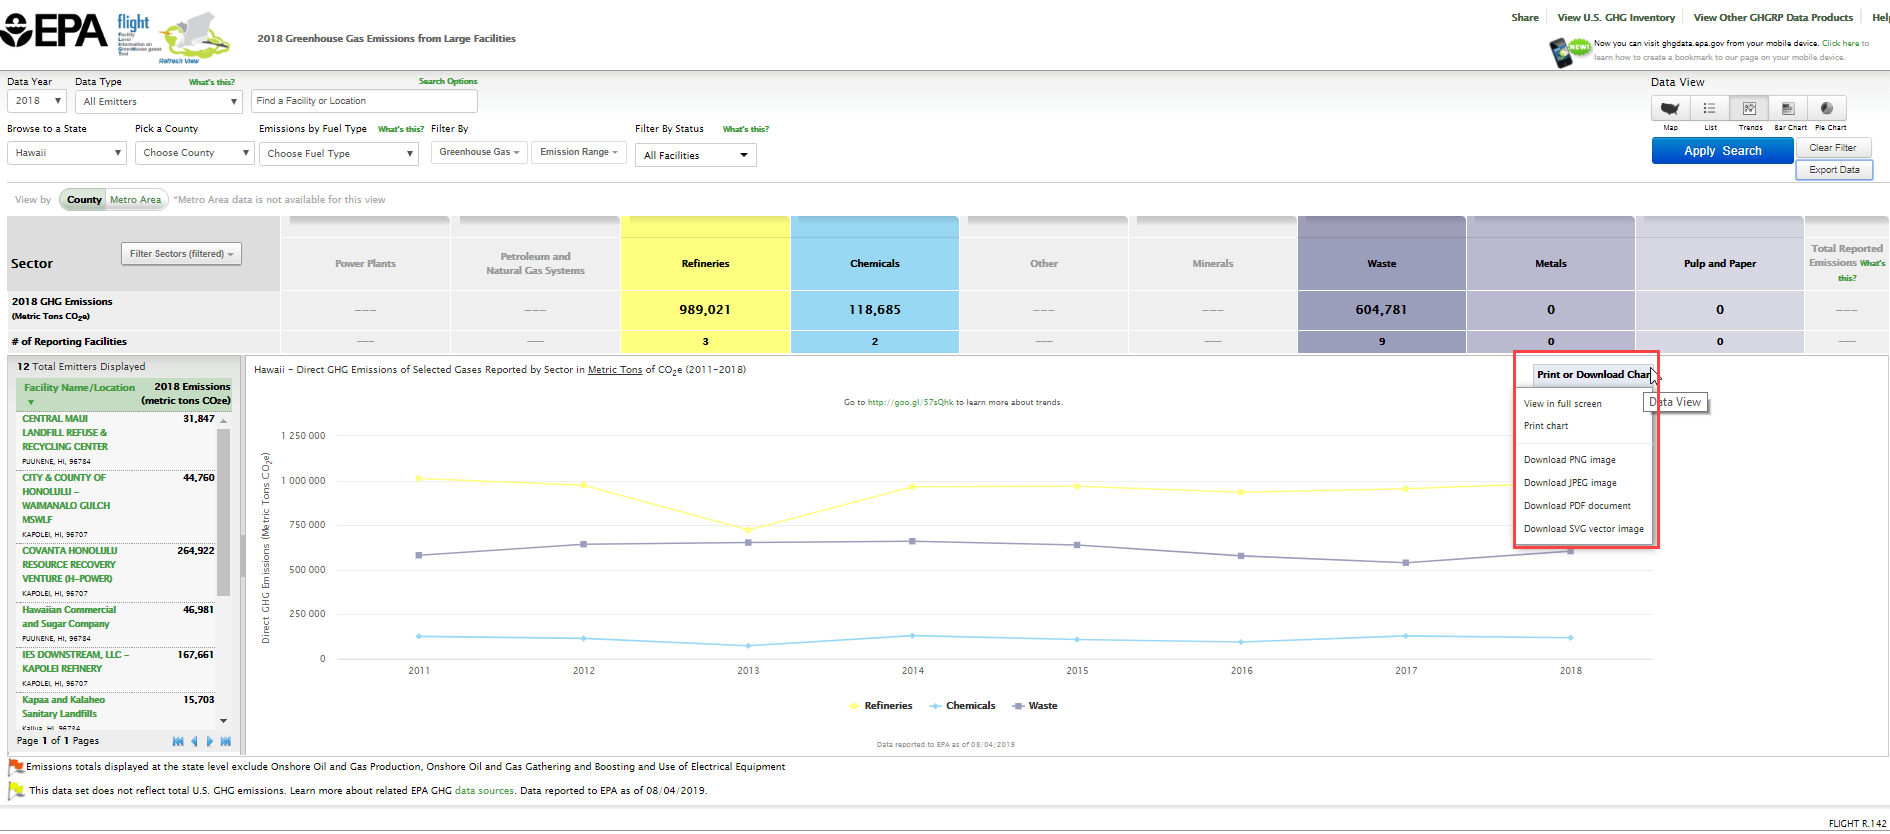

Step 6. Zoom in Lower Portion of the Chart
In many cases a number of trend lines may be crowded on the lower portions of the chart. To get a magnified view of these trend lines, Click "Focus on Bottom Sectors".
Click image to expand below


To reset the view, click on the "Reset Zoom" Button
click image to expand below

